iFOOD CUSTOMER SEGMENTATION ANALYSIS
Introduction to Programming for Business (DESN 210)
View the full report and Jupyter Notebook file.
OVERVIEW
This project analyzes customer demographic and behavioral data for iFood, the leading food ordering and delivery platform in Brazil, in Python. The analysis evaluates which customer characteristics most strongly influence spending and marketing campaign acceptance.
Statistical testing shows that education level and household income significantly predict spending, while education level also significantly affects Campaign 4 acceptance rates. Together, these results support segmentation recommendations that prioritize high-value customers for improved marketing efficiency.
OBJECTIVE & RESEARCH QUESTION
Objective
Quantify the strength and direction of relationships between customer demographics, purchasing behavior, and campaign acceptance rates to support evidence-based segmentation strategy.
Research Question
Do spending patterns and campaign acceptance rates significantly vary across demographic groups?
DATASET & PREPARATION
This analysis uses the iFood Data Classification dataset, which includes demographic and behavioral data for 2,204 iFood customers in Brazil. Variables include age, education level, marital status, and household income, along with purchasing behavior across multiple product categories and acceptance rates across five marketing campaigns. The data spans a two-year period, and all monetary values are recorded in Brazilian Real (BRL/R$).
To improve segmentation analysis, derived variables measure household size and average spending across regular (non-gold) product categories. Additionally, boolean indicators for education level and marital status were transformed into categorical variables.
METHODS
The analysis begins with data cleaning and validation in Python to ensure accuracy across variables. Next, exploratory analysis evaluates spending behavior and campaign acceptance patterns across key demographic factors, including marital status, education level, and household income. Spending is measured using average regular product purchases, while campaign engagement is assessed through acceptance rates across Campaigns 1 through 5.
To support interpretation, bar charts and scatter plots visualize observed patterns and highlight potential relationships. Based on these findings, the project develops four testable hypotheses aimed at identifying high-value customer segments. Finally, one-way ANOVA testing (α = 0.05), correlation analysis, and linear regression modeling measure statistical significance and quantify the strength of key relationships.
KEY FINDINGS
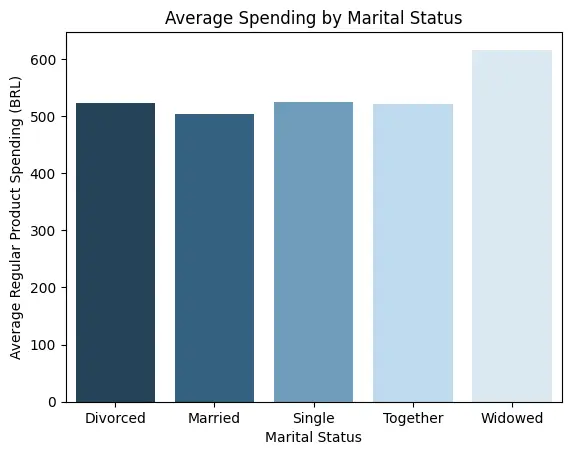
Marital status does not significantly predict customer spending.
Widowed customers spent an average of 616 R$, while other marital status groups spent between 504 R$ and 525 R$.
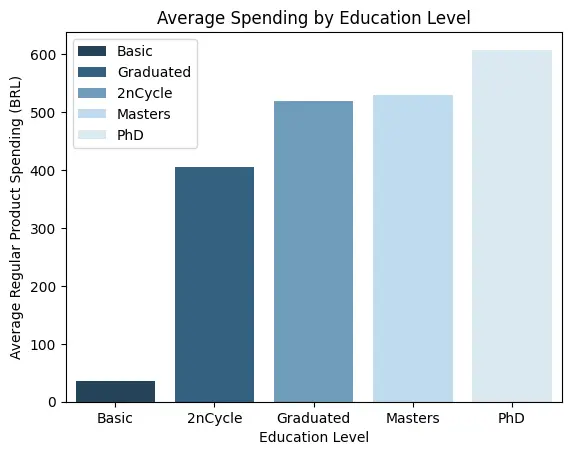
Education level significantly influences regular product spending.
Customers with a PhD spent an average of 608 R$ on regular products, exceeding the overall sample average by 90 R$. Additionally, spending varies substantially across education categories, with a total range of 572 R$.
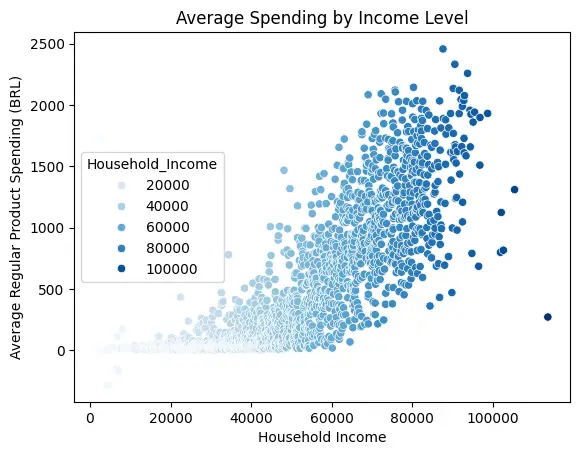
Household income strongly predicts higher customer spending.
For every 1 R$ increase in income, average regular product spending increases by 0.03 R$. Income explains approximately 67% of the variance in spending, confirming a strong relationship between purchasing power and customer value.
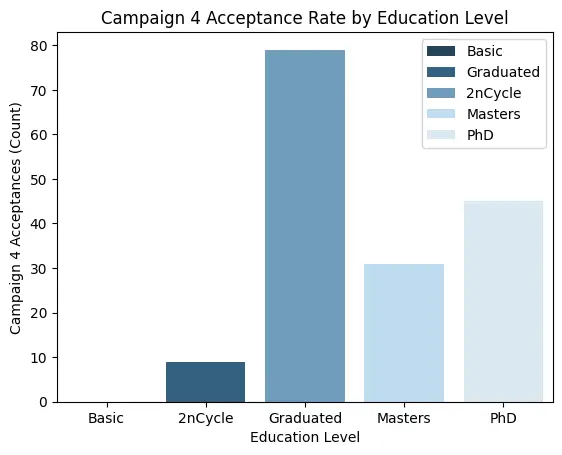
Education level significantly influences acceptance rates for Campaign 4.
ANOVA testing shows that marital status and education level do not affect acceptance rates for campaigns 1-5 in nearly all cases. However, customers with a bachelor’s degree or equivalent (“Graduated”) are significantly more likely to accept Campaign 4.
RECOMMENDATIONS
Segment by Education & Income Levels
Education level and household income show the strongest relationships with customer spending, making them effective primary segmentation variables for regular product purchasing. To maximize customer value, iFood should prioritize higher-income and higher-education customer groups through tailored messaging, targeted promotions, and value-based campaign strategies.
Optimize Campaigns Using Education-Level Insights
Campaign 4 performs significantly better among customers with a bachelor’s degree or equivalent, suggesting education level influences campaign engagement under specific conditions. To capitalize on this opportunity, iFood should run A/B testing to identify which Campaign 4 elements drive stronger acceptance among the “Graduated” segment. These insights would support more precise campaign personalization and improve targeting efficiency across education groups.
Future Research & Data Collection
Future analysis should evaluate interaction effects, such as income × education, to determine whether combined demographic factors strengthen segmentation accuracy. Additionally, incorporating behavioral indicators such as recency, web visits, and discount-driven purchasing would provide deeper insight into engagement patterns. Finally, additional campaign-level metadata—such as channel, creative, and timing—would support stronger interpretation of campaign performance and clarify why specific segments respond differently.